Quick start tutorial
New to Sympathy for Data? These guides walk you through the steps of the most basic usage of the Sympathy for Data GUI.
Working with nodes and workflows
Workflows, or simply flows, are the documents/files that you can create in Sympathy. Each workflow represents the flow of data through an analysis process and they are made up of connected nodes. Each node performs a small, standardized task to import, prepare, analyze, visualize, or export data. Both individual nodes and entire workflows are designed to be easily shared among users.
What follows is a short tutorial of some of the most basic uses of Sympathy.
Executing a node and looking at the result
When you first start Sympathy you are presented with an empty workflow and, to the left, a library where all the available nodes can be found. Let us add the node “Output Example” to our workflow, execute it and see what it does.
At the top of the library view you will find a filter area. Type “Example” in the library filter to only show nodes whose names contain all those letters. Drag the node “Output Example” onto the empty workflow area to create an instance of that node. The little gray square just to the right of the node is the node’s output port.
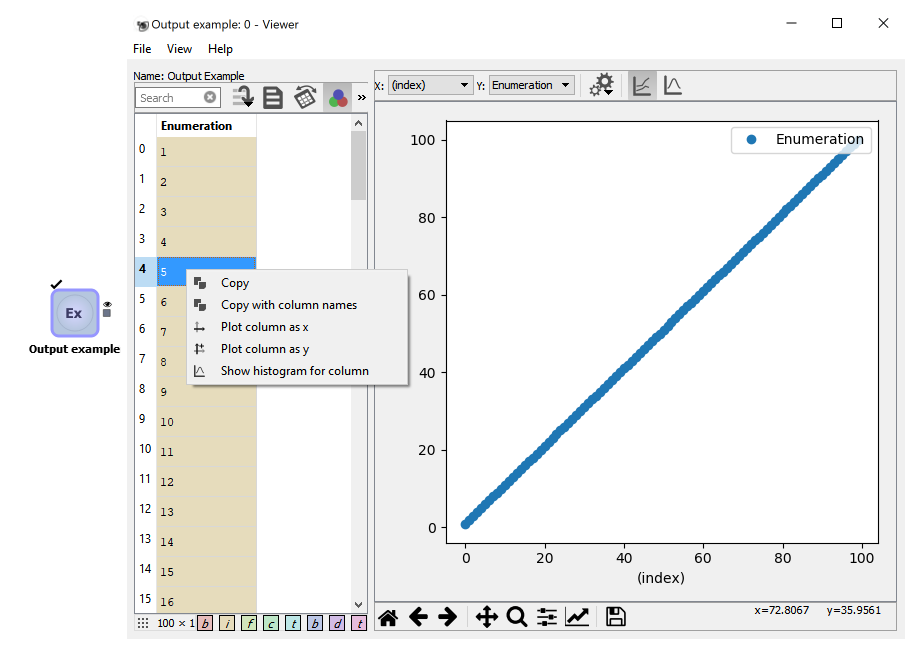
Now double click on the node to start executing it. When the execution is done and the node has turned green with a little tick above it, double click on the output port. This will open up a viewer that shows the data that this node has produced: A table with one column named “Enumeration” which contains the numbers 1 through 100.
Double clicking on output ports to view what data a node has produced is a very handy approach when developing or debugging workflows.
Loading and executing a workflow
Go to File->*Open…* and open the workflow file <sympathy install directory>/Sympathy/Doc/workflows/Cardata workflow.syx. In Windows, double clicking on the workflow file in a file explorer window will also bring it up in Sympathy.
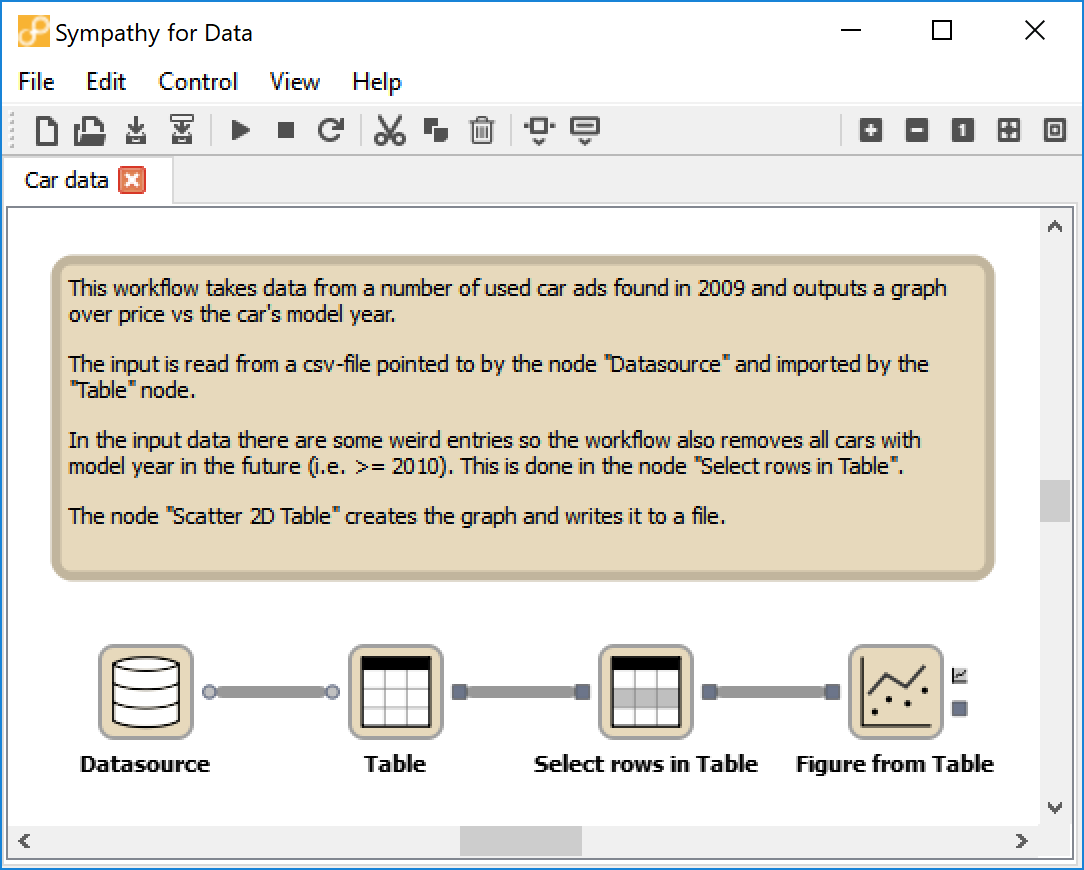
As you can see this flow contains several nodes connected to one another by wires. You can run all the nodes in this workflow by double clicking on the last (rightmost) node. You can view the figure by doble clicking the output port.
Read the help text in the big text field to find out what the individual nodes in the workflow do.
Configuring nodes
Many nodes can be configured to perform their task in different ways. Right clicking on a node and choosing Configure will bring up the configuration GUI for that node. Some nodes have very simple configuration GUIs whereas other nodes have very complex configuration GUIs. You can read the help texts for any specific node by right clicking on a node and choosing help.
In the last example the node “Select rows in Table” was specifically set up to only show entries with year < 2010. Let us change it to only show entries with year < 2000. First execute the Datasource and Table nodes by double clicking on the Table node. This is done to make sure that the node has access to the relevant data and can present a list of the different columns in the indata. Right click the node Select rows in Table, choose Configure and change the year in the field Filter constraint. Now click Ok and run the rest of the workflow.
Have a look at the configurations of the other nodes as well while your at it. You can always press Cancel in any configuration GUI and be sure that no changes will be made to the configuration of that node.
As another example, if you only want cars of a specific brand, you can simply add a second Select rows in Table node in series between the old node of that type and the Figure from Table node (you will have to delete the old connection).