Welcome! Let's get started with Sympathy for Data. Continuing from the video where we cleanup data, in this video you will learn how to create and export plots
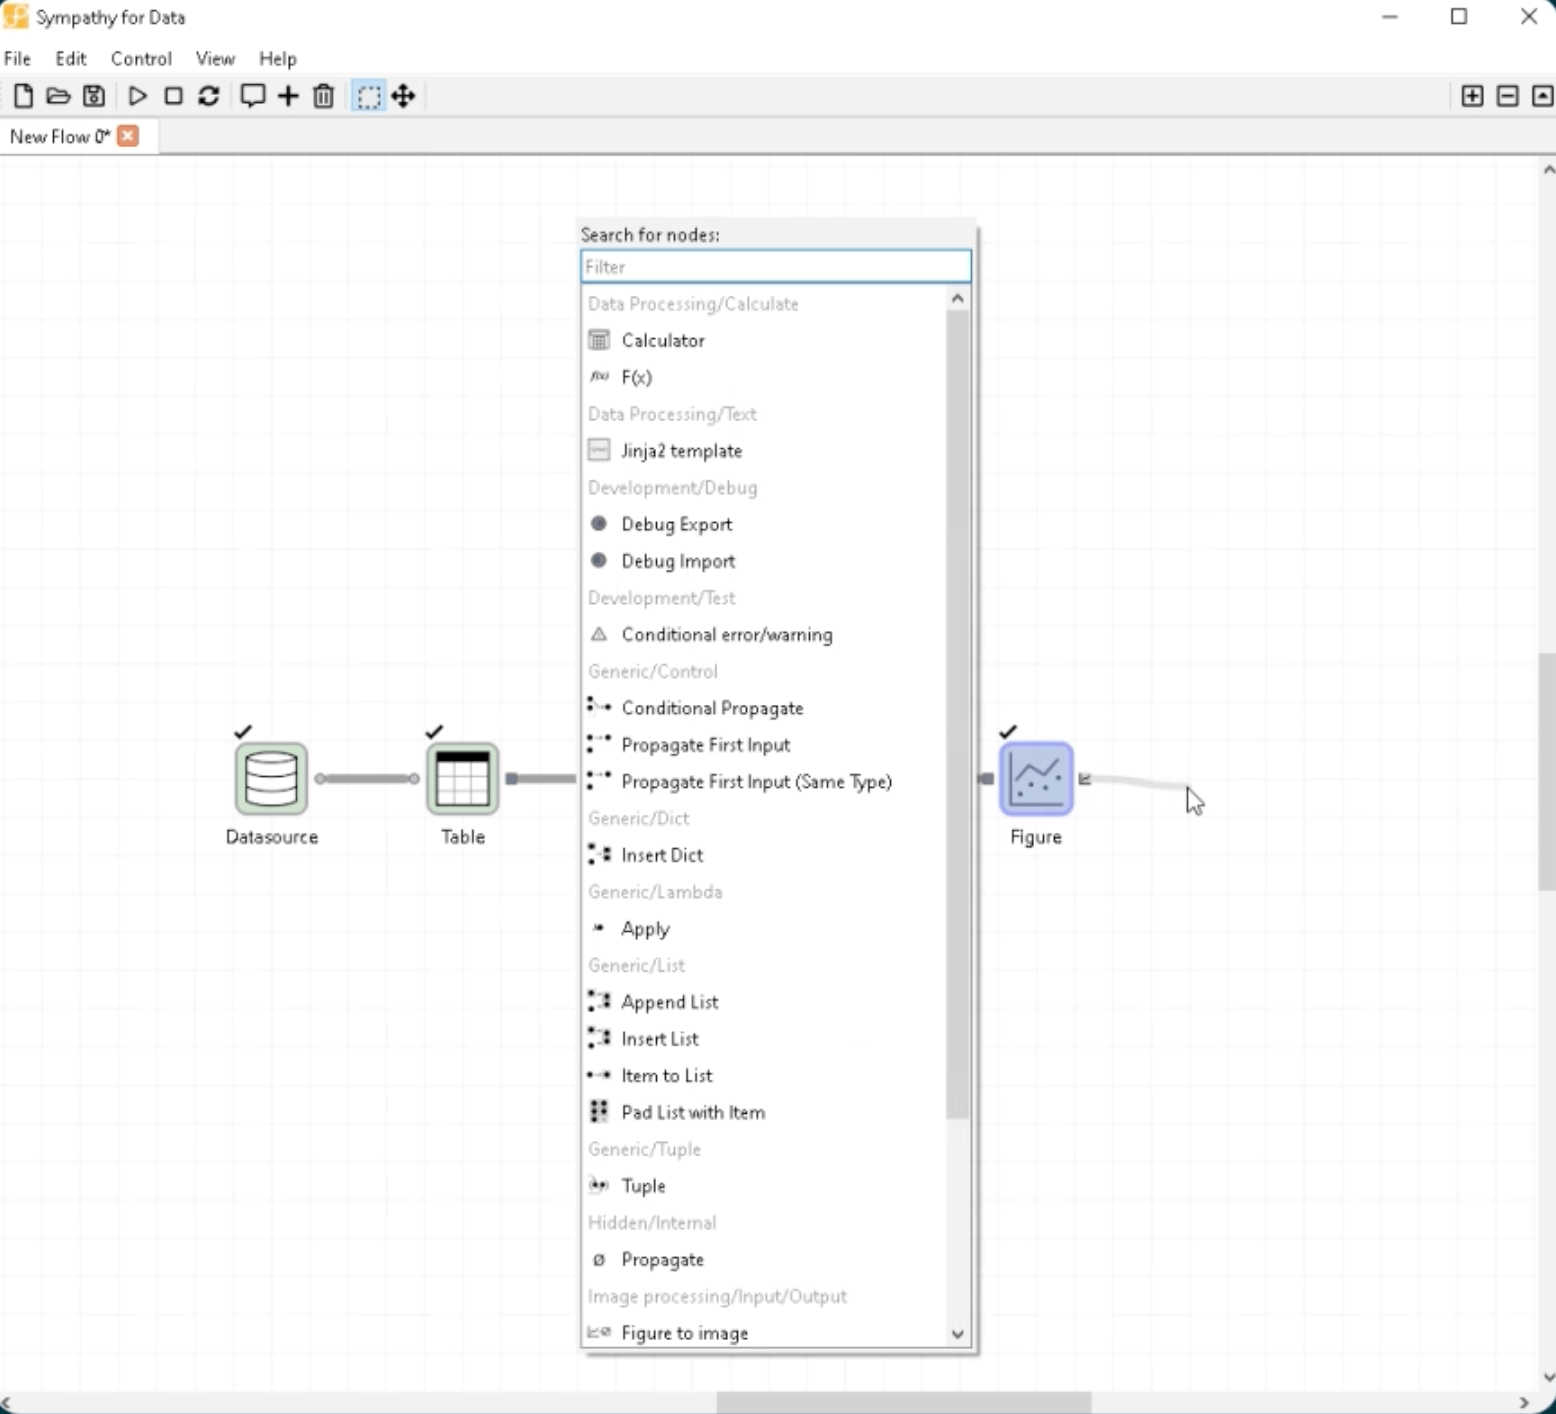
Step 1: Start connecting a new node
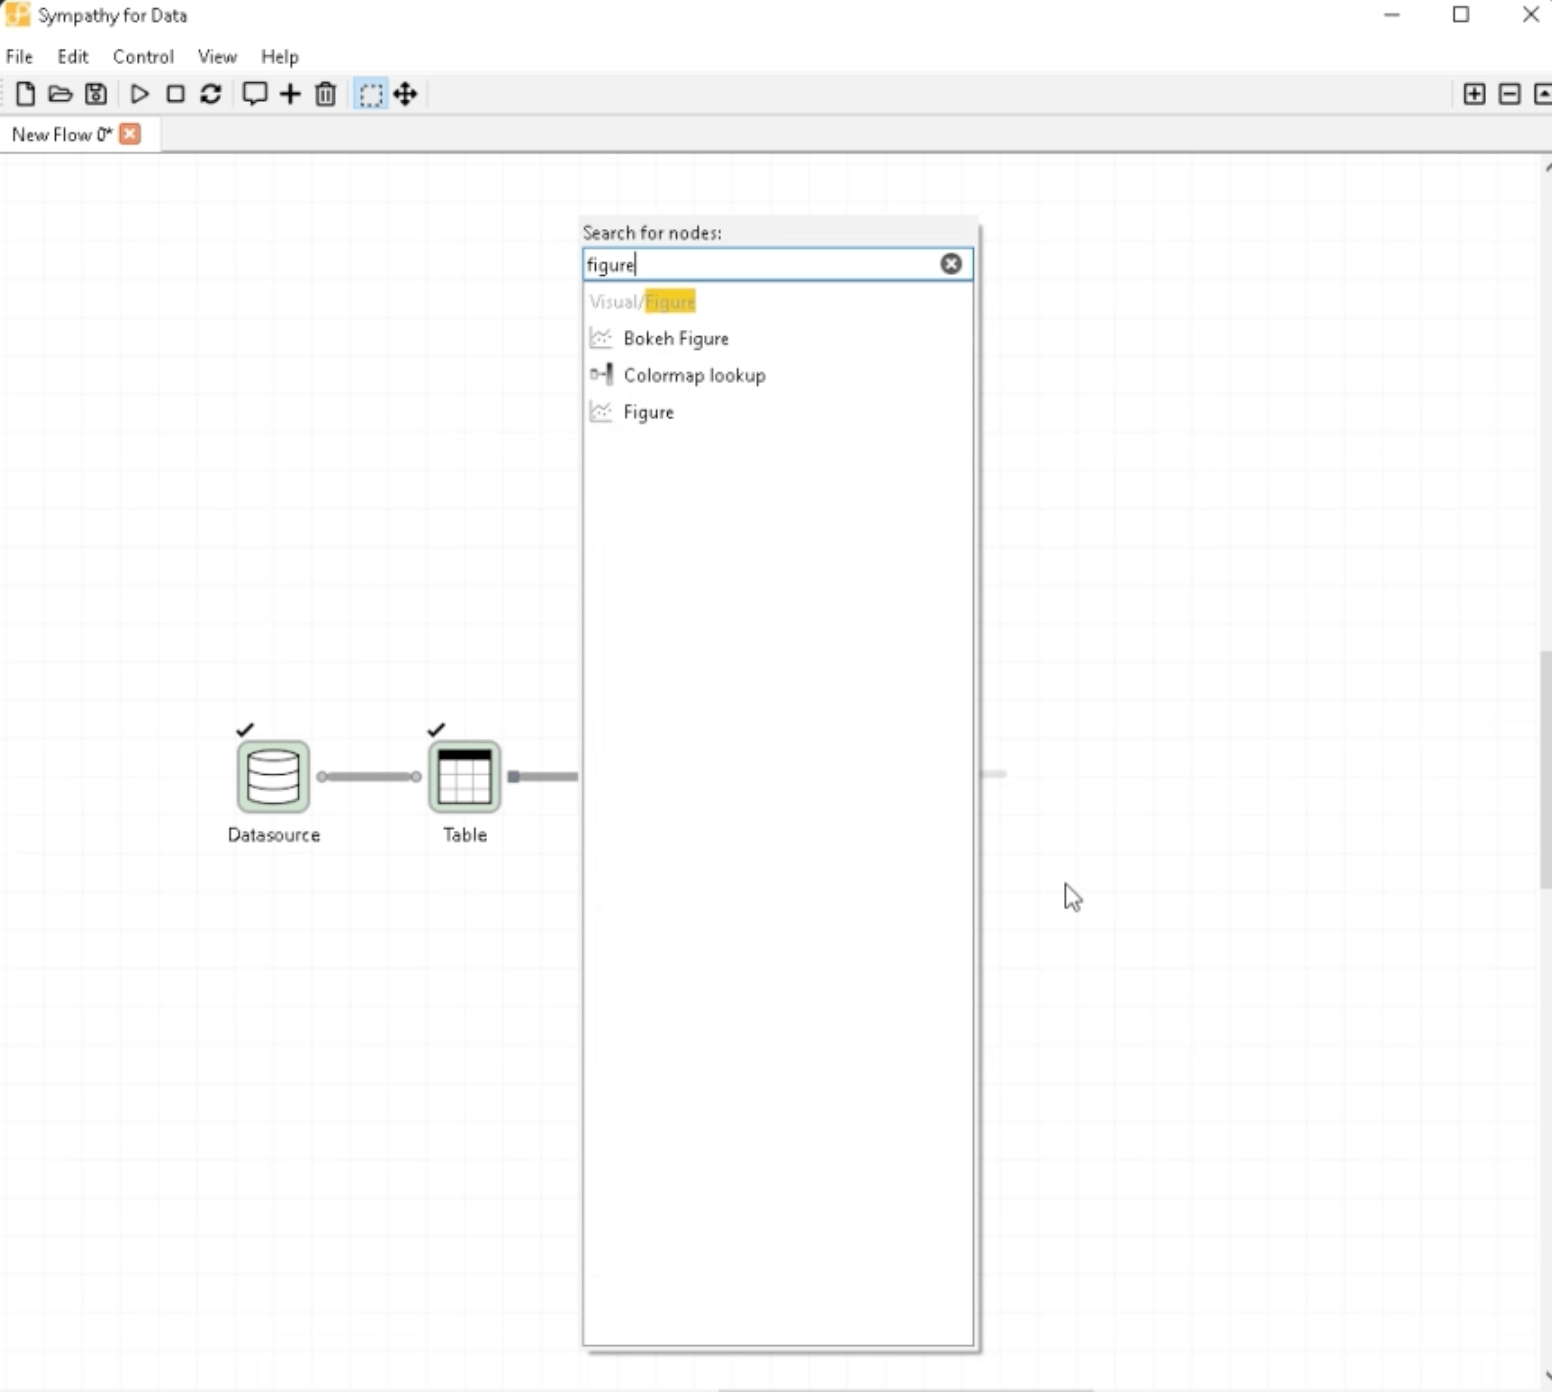
To start, drag from the output port and drop to begin connecting a new node. Choose the "Figure" node.
Step 2: Configure node
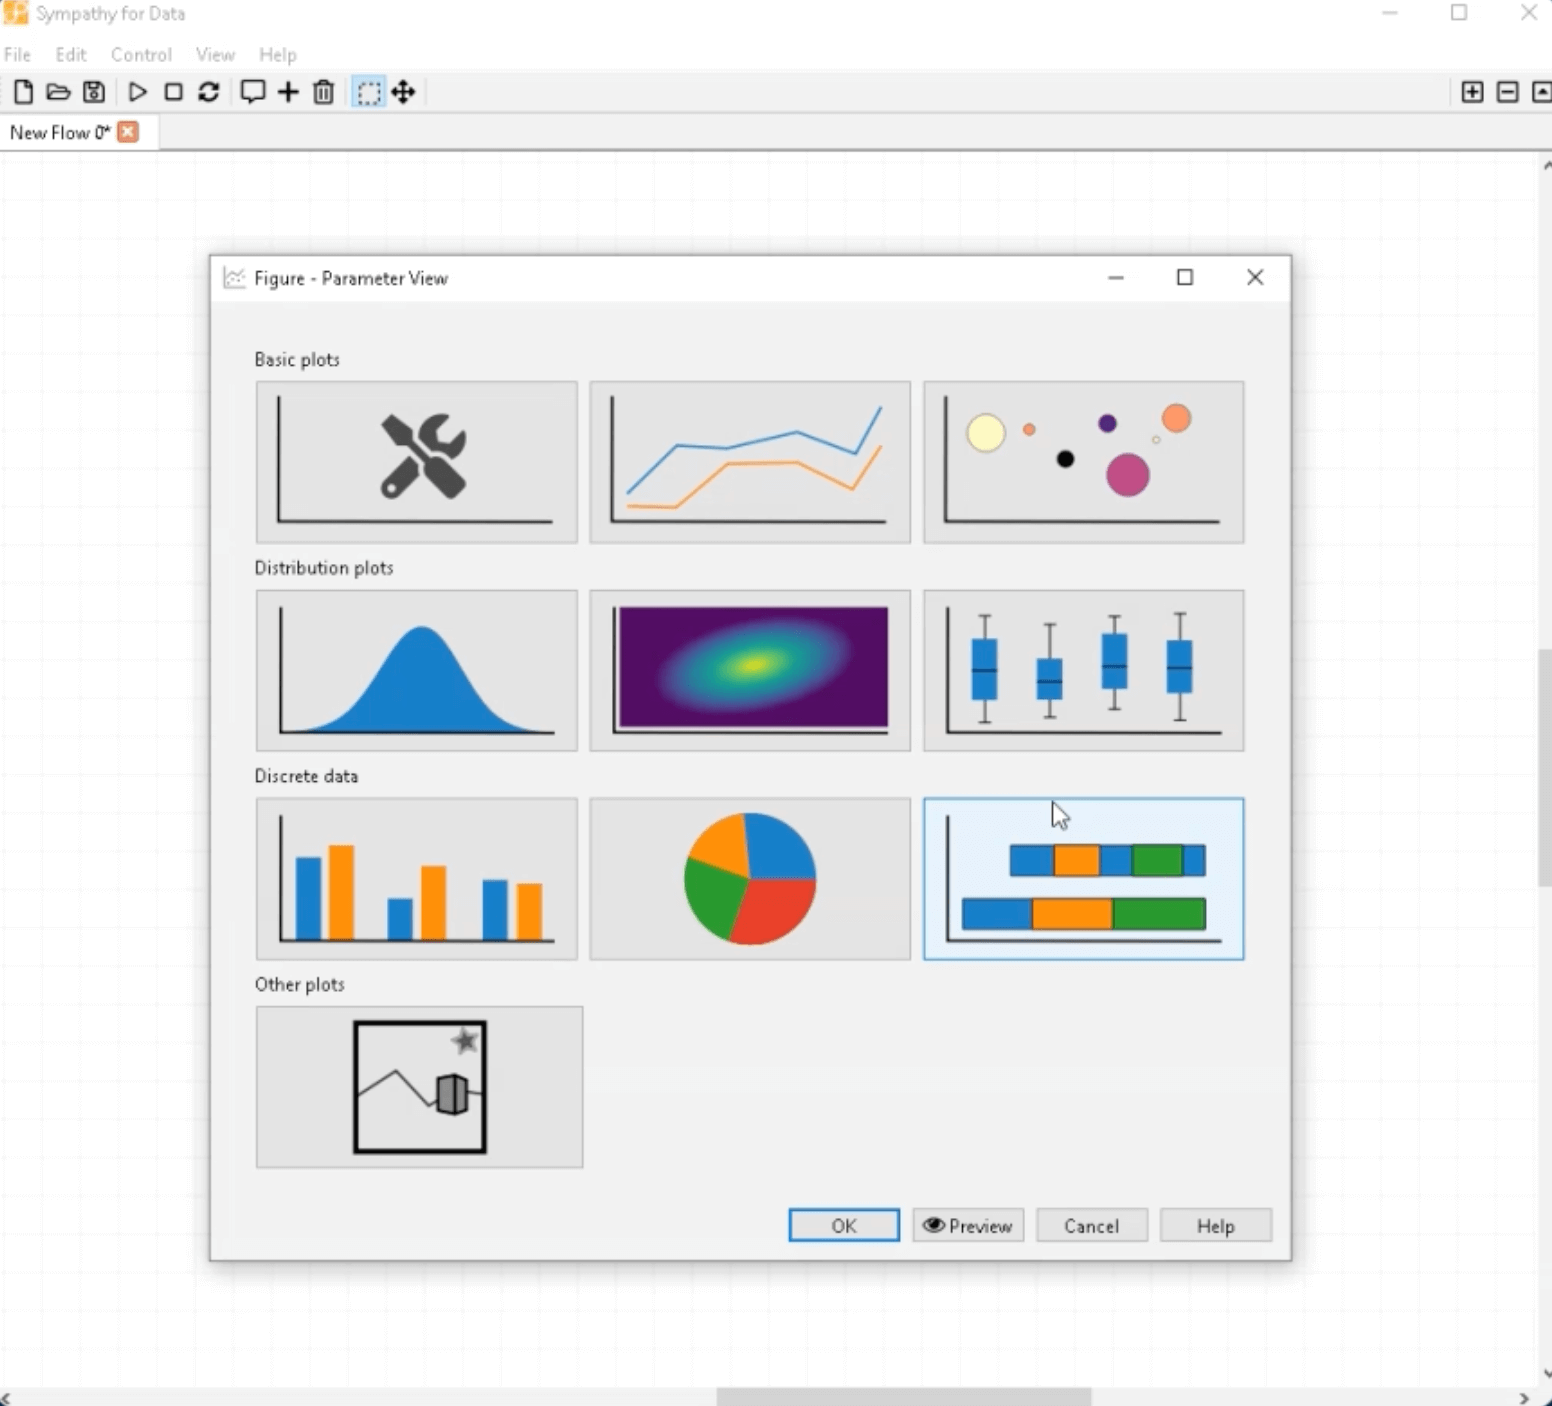
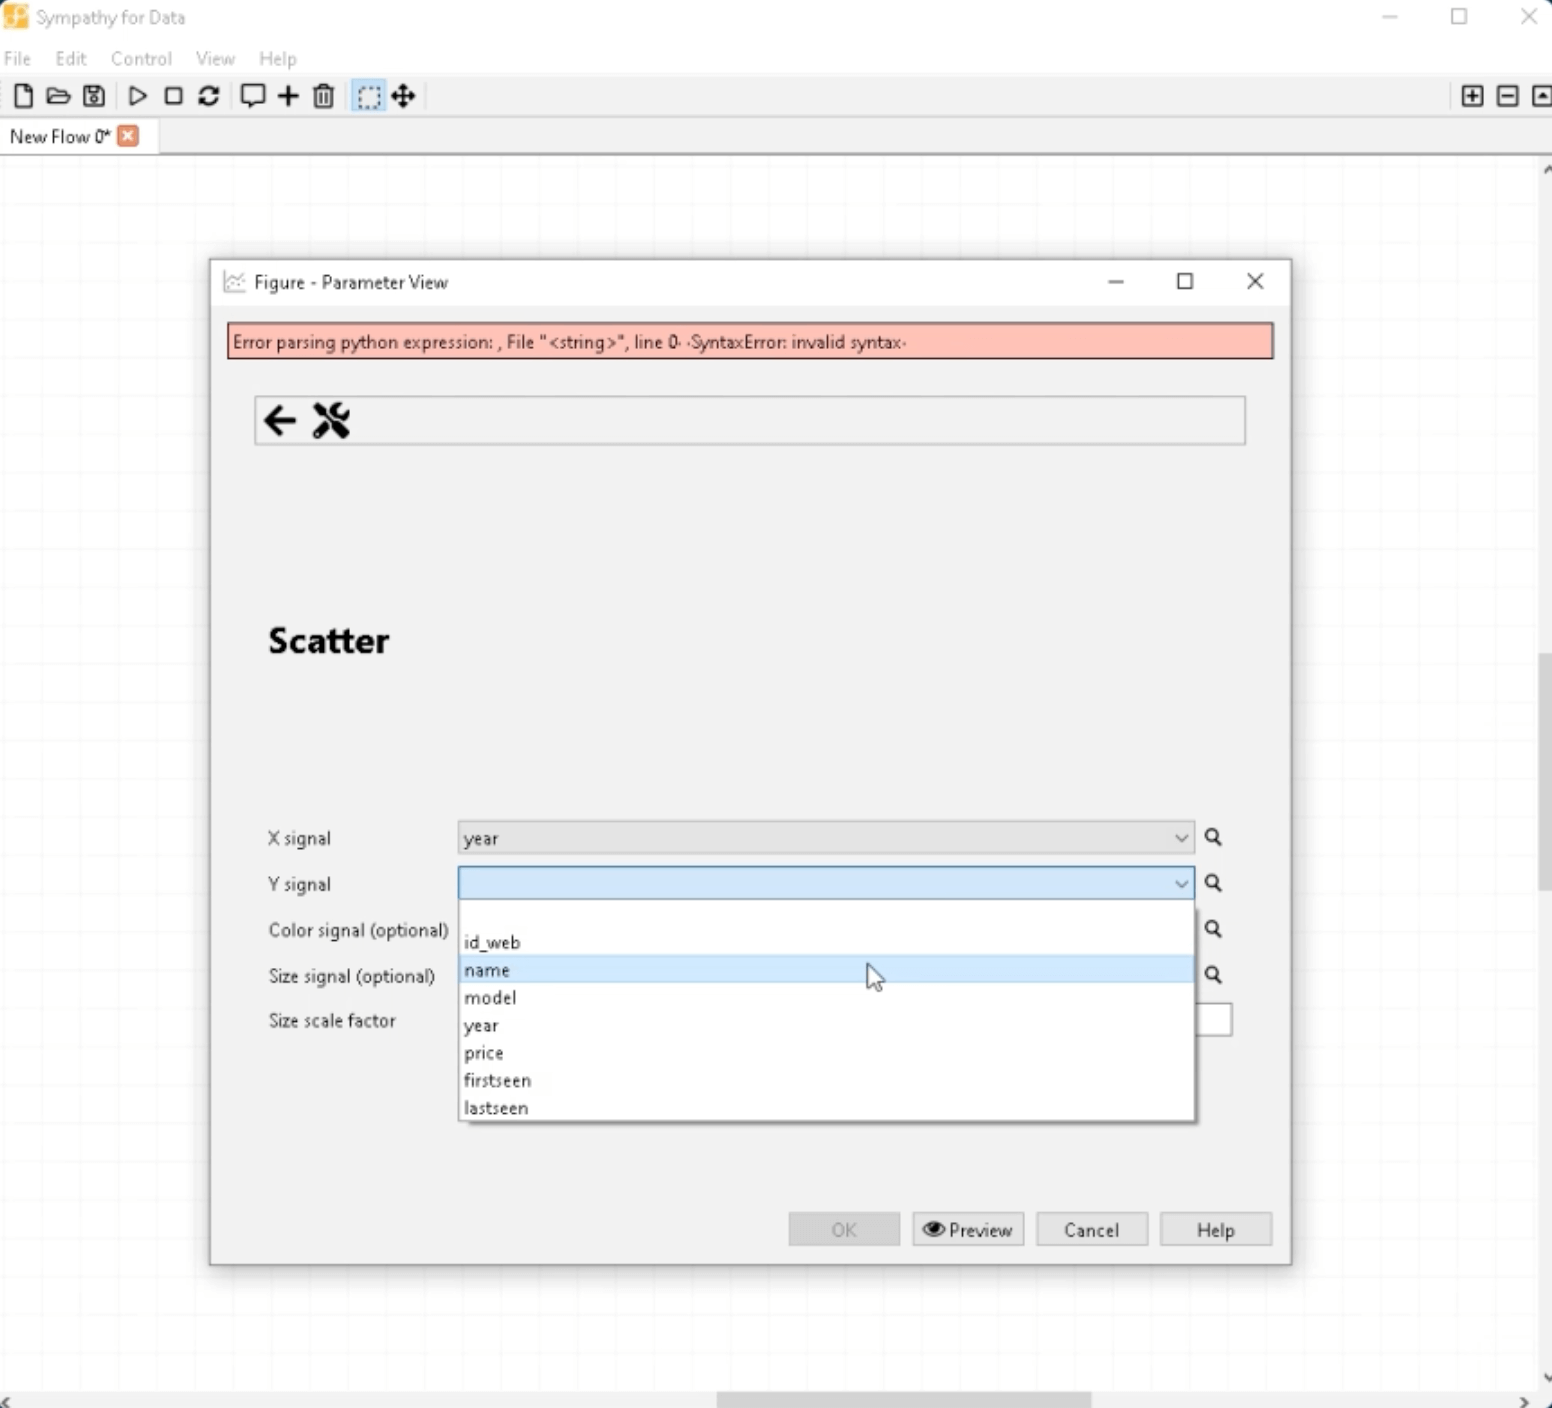
After that, configure the "Figure" node. Choose the scatter plot option and select "year" as X signal and "price" as Y signal. The other settings are optional based on your preference.
Step 3: Saving and Executing
Save the node's configuration and execute the node.
Step 4: Opening the Data Viewer
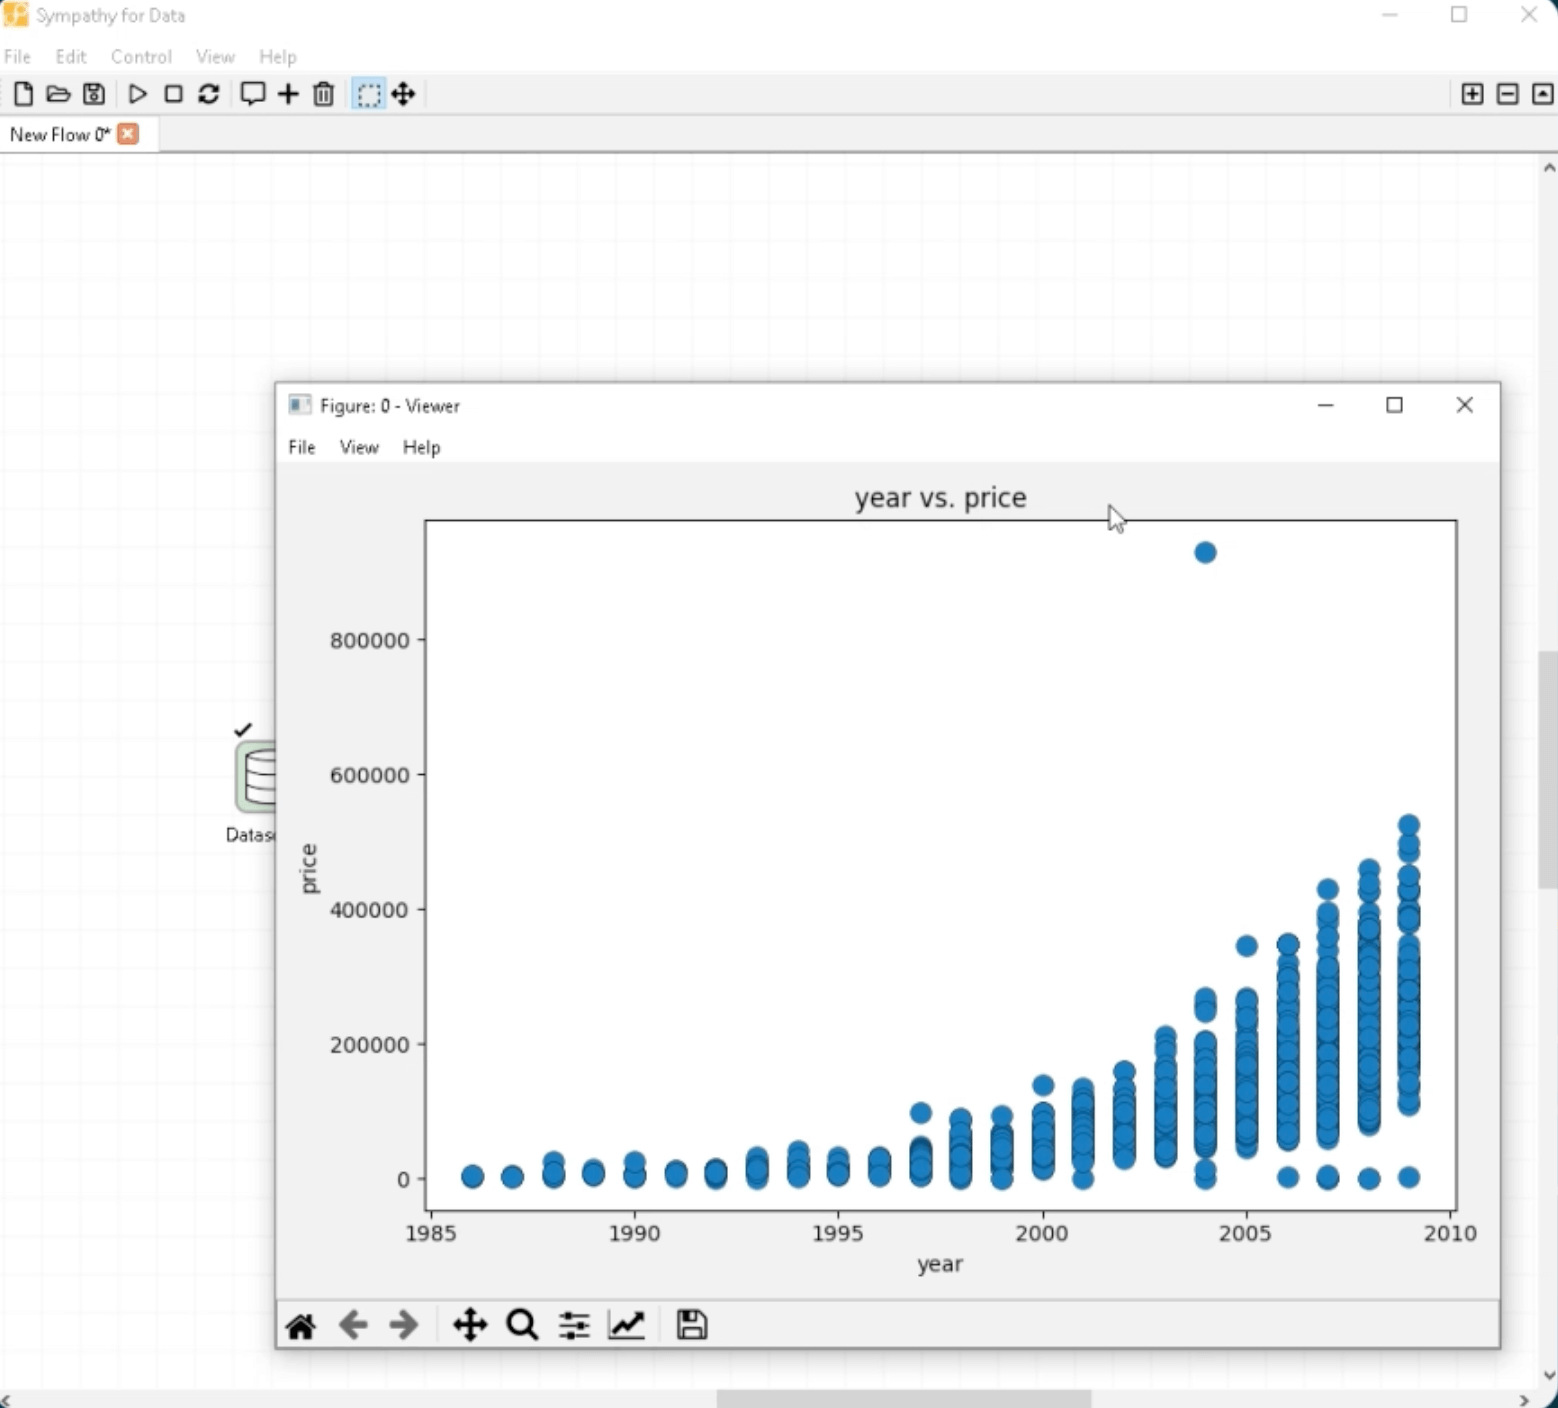
Open the data viewer. You'll find the figures shown as a plot. This plot displays "year" on the x-axis and "price" on the y-axis. You can close the viewer when you're done.
Step 5: Exporting the Figure Plot
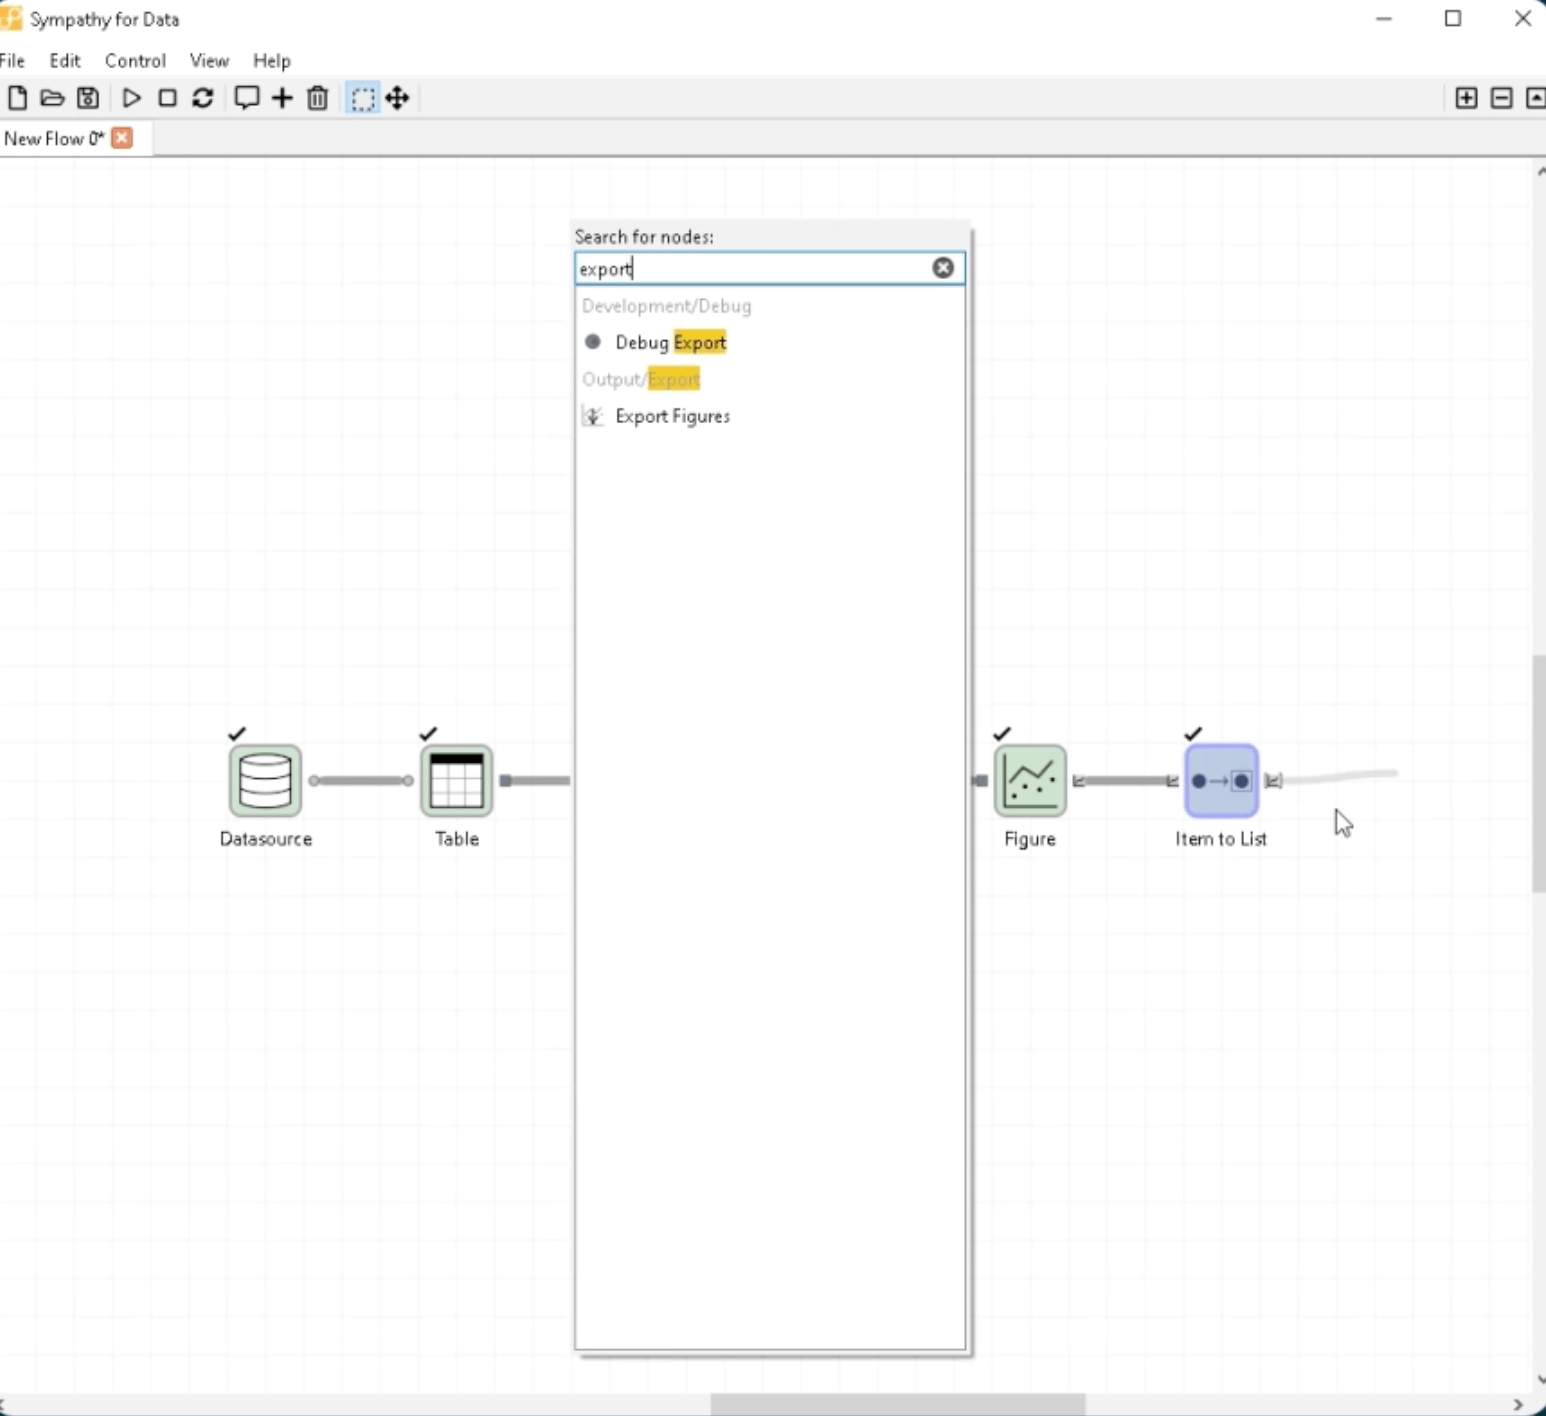
Now, let's export the figure plot. Start connecting a new node and choose "Item to List". This is a type conversion needed for the next node. Execute this node.
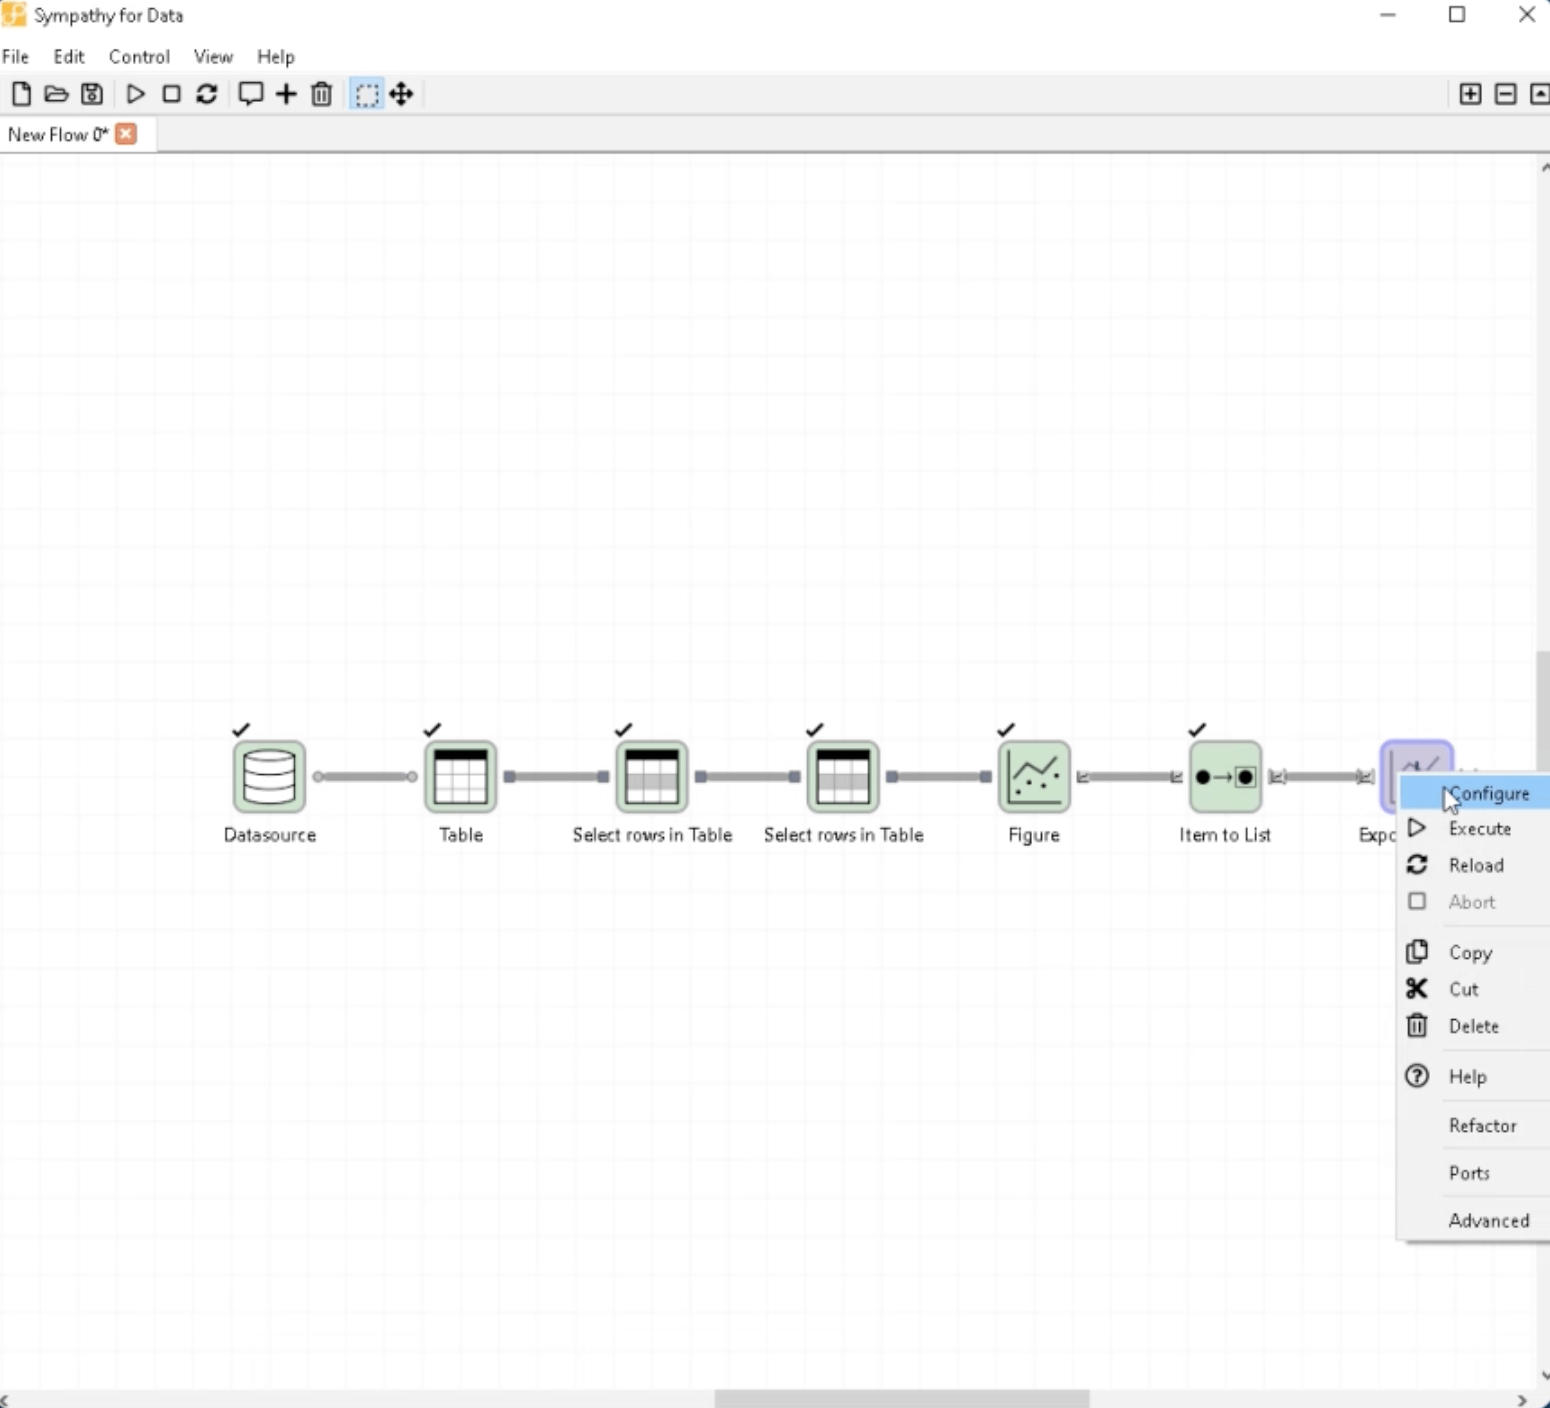
Step 6: Connecting Another Node
Now start connecting another node. Choose "Export Figures" for this node.
Step 7: Configuring the Export Node
Configure the "Export Figures" node. Click on the "..." button to browse for the output directory.
Step 8: Creating a New Directory
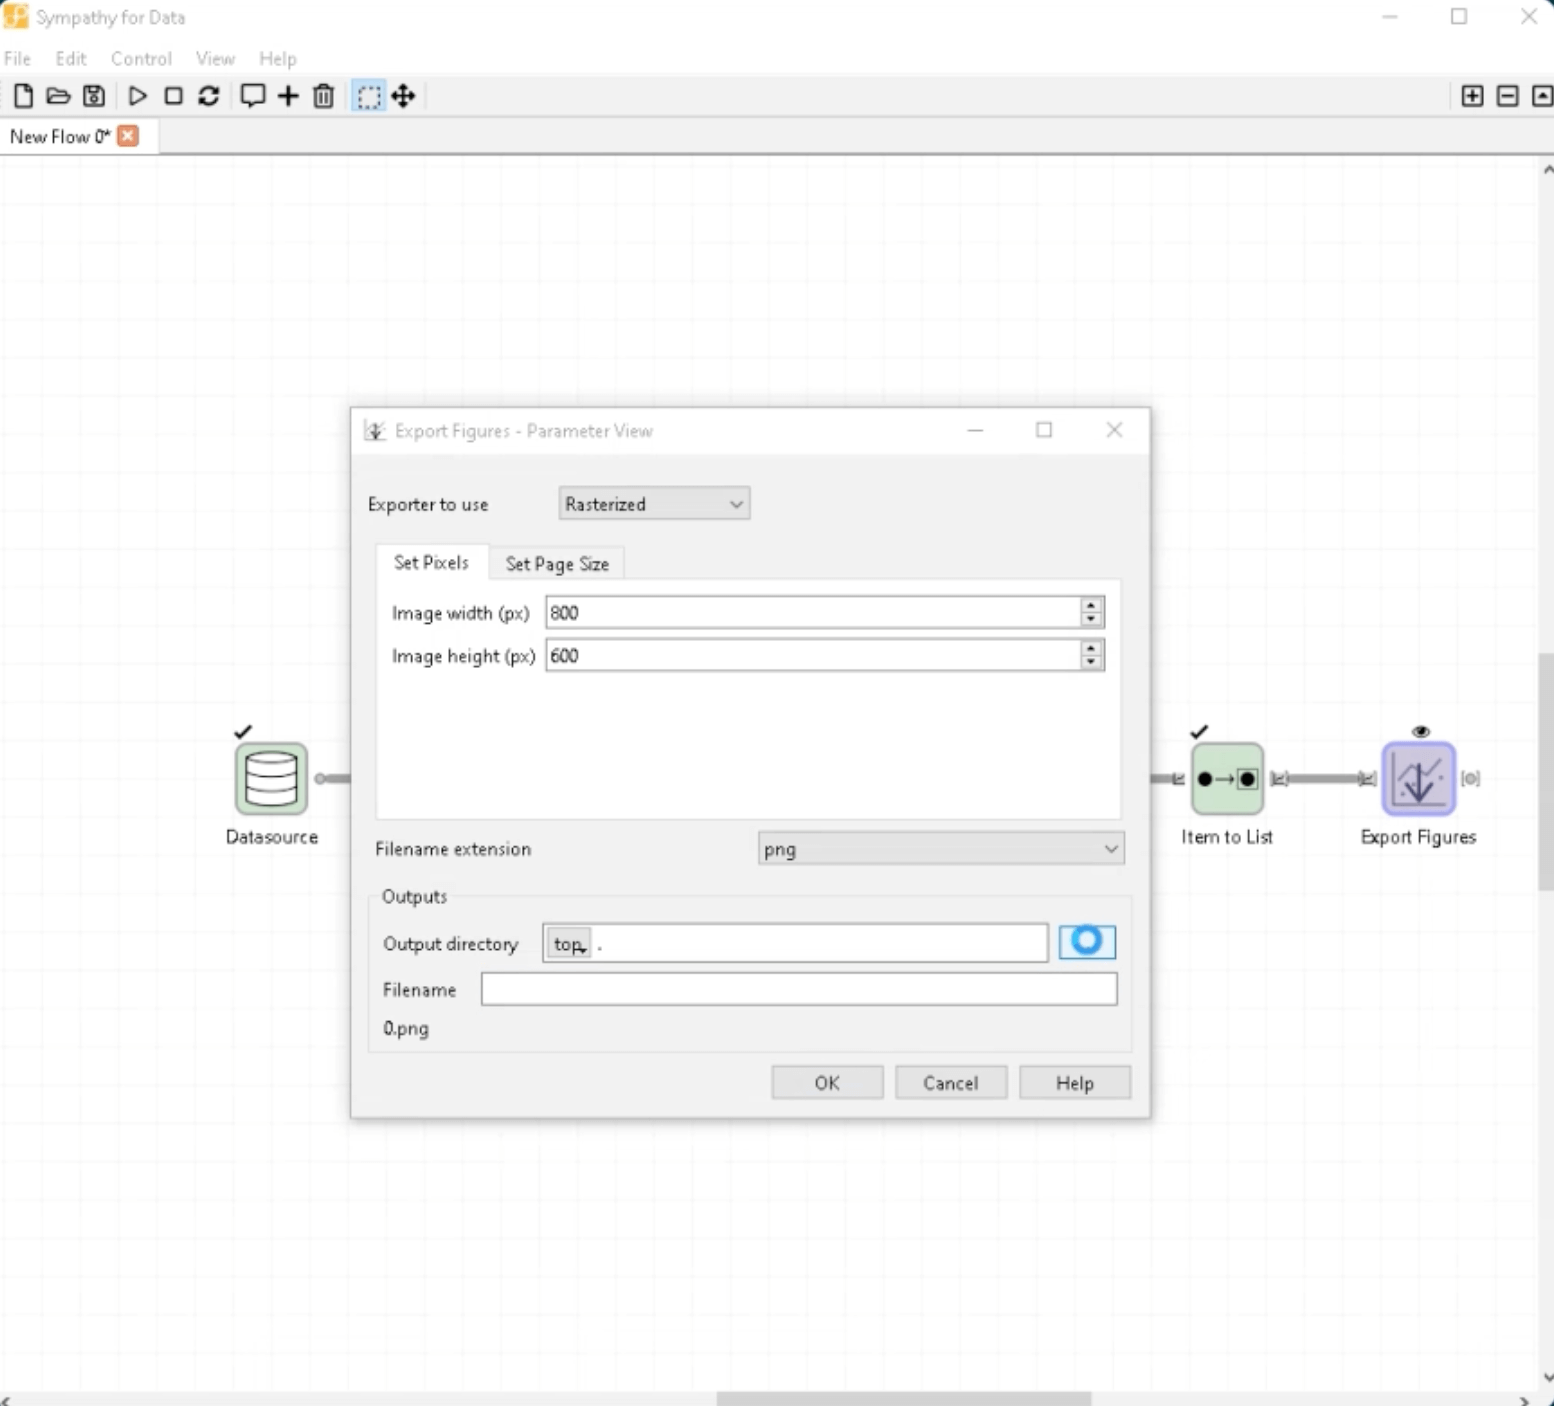
Instead of using an existing directory, let's create a new directory called "Plots". Select it as the output directory.
Step 9: Setting the Filename and Exporting
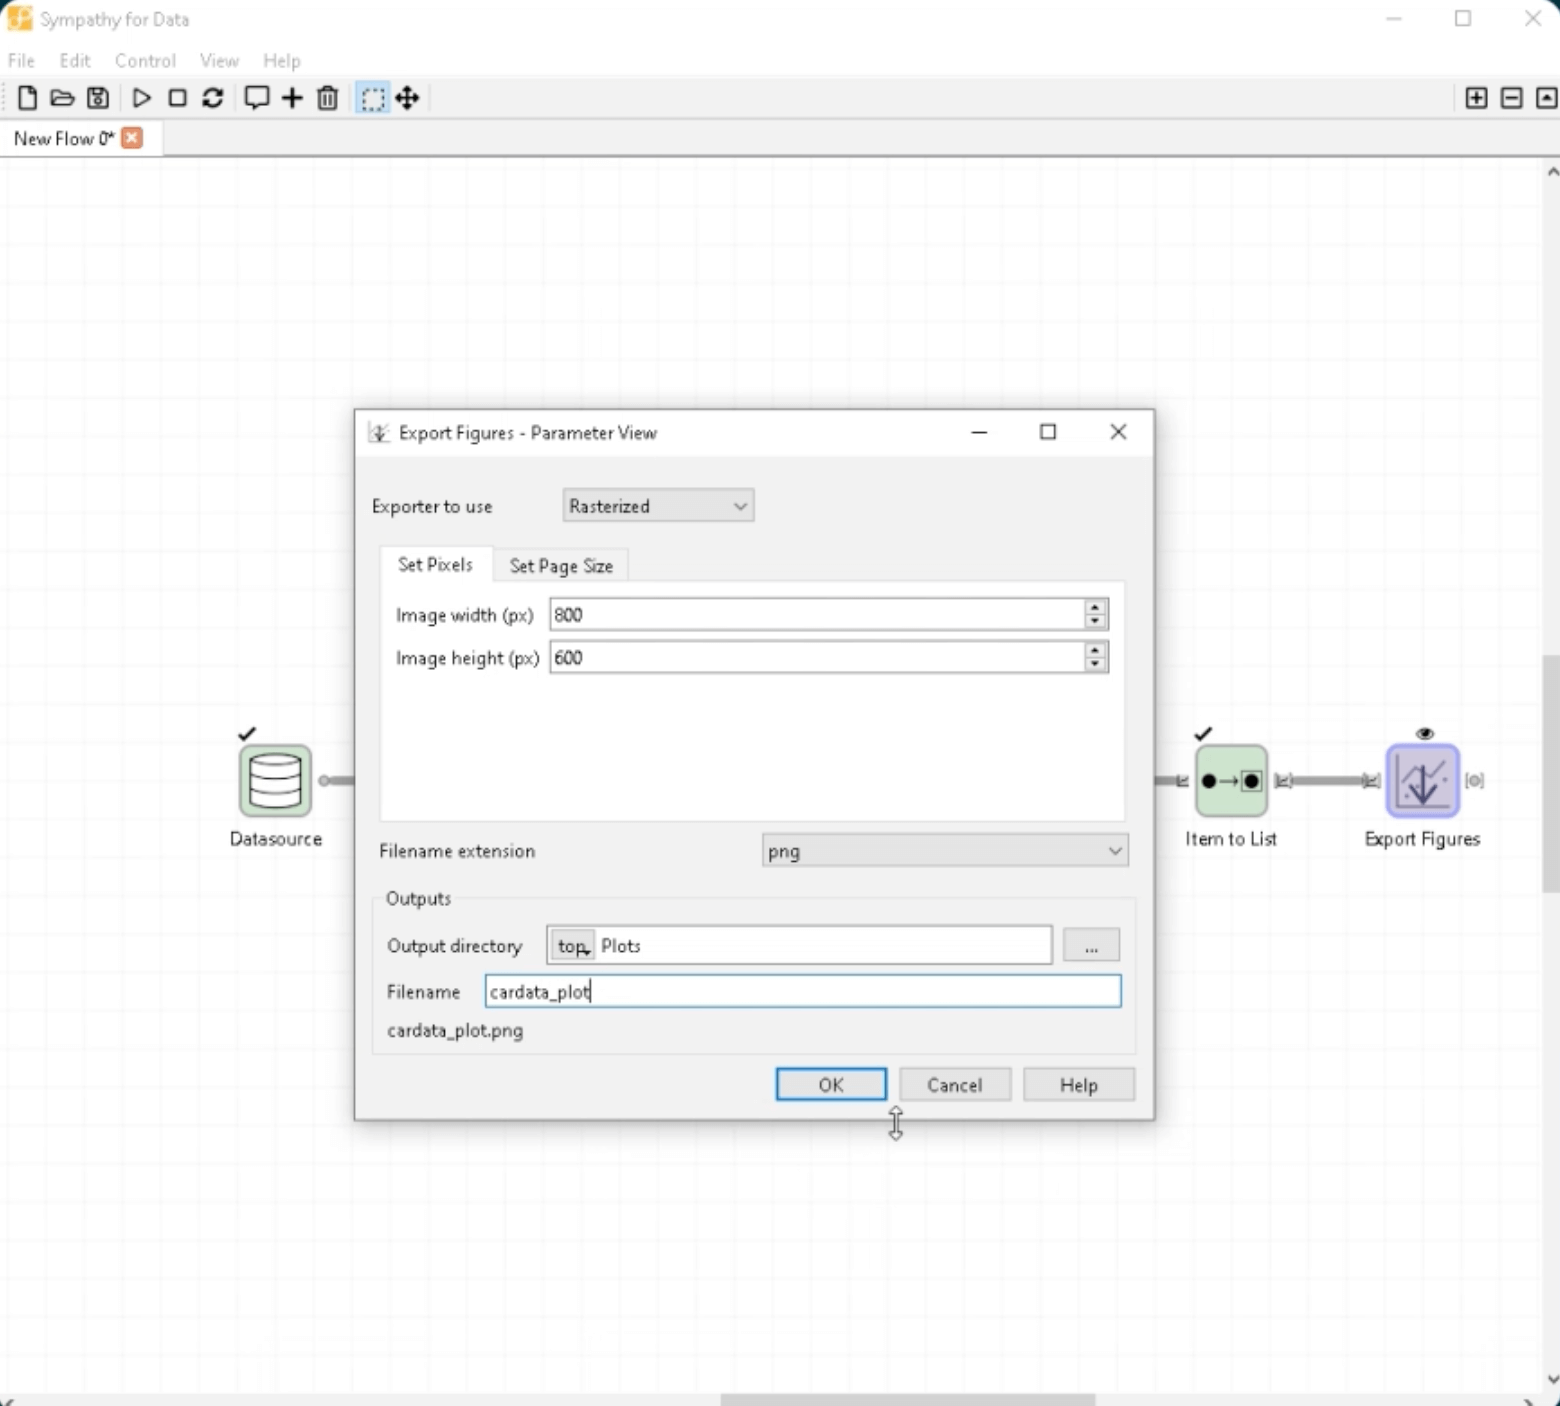
Type "cardata_plot" as the filename. Press OK to save the node's configuration. Execute it so that "cardata_plot.png" is exported.
Congratulations, now you know how to create and export plots using Sympathy for Data!
Thank you for watching and stay tuned for more Sympathy for Data tutorials!


