Windows
The graphical user interface or GUI for Sympathy for Data is the main interface, where you can create, edit, and run workflows.
In the main interface of Sympathy for Data a number of smaller windows can be displayed, where each of these windows have their own functionality. When Sympathy for Data is started two of these windows will be displayed, the workspace window and the node library window. These two windows are vital for the construction of the workflows. The other windows are more informative.
All windows, except the workspace window, can be turned on/off from the View menu.
A screenshot of the start view in Sympathy for Data is shown below. In this screenshot the workspace window and the node library window are located to the right and the left, respectively.
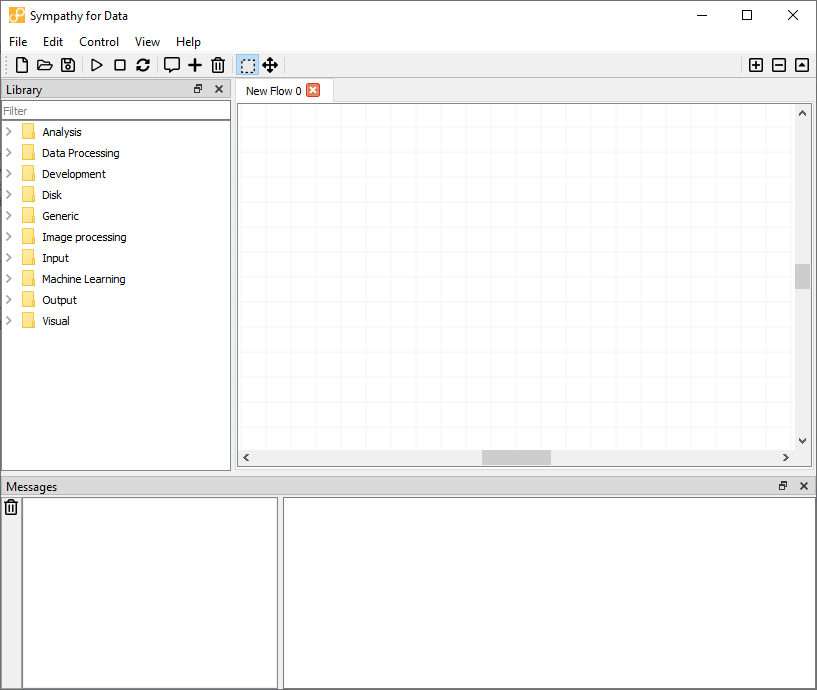
Screenshot of the startup view of the main window in Sympathy for Data.
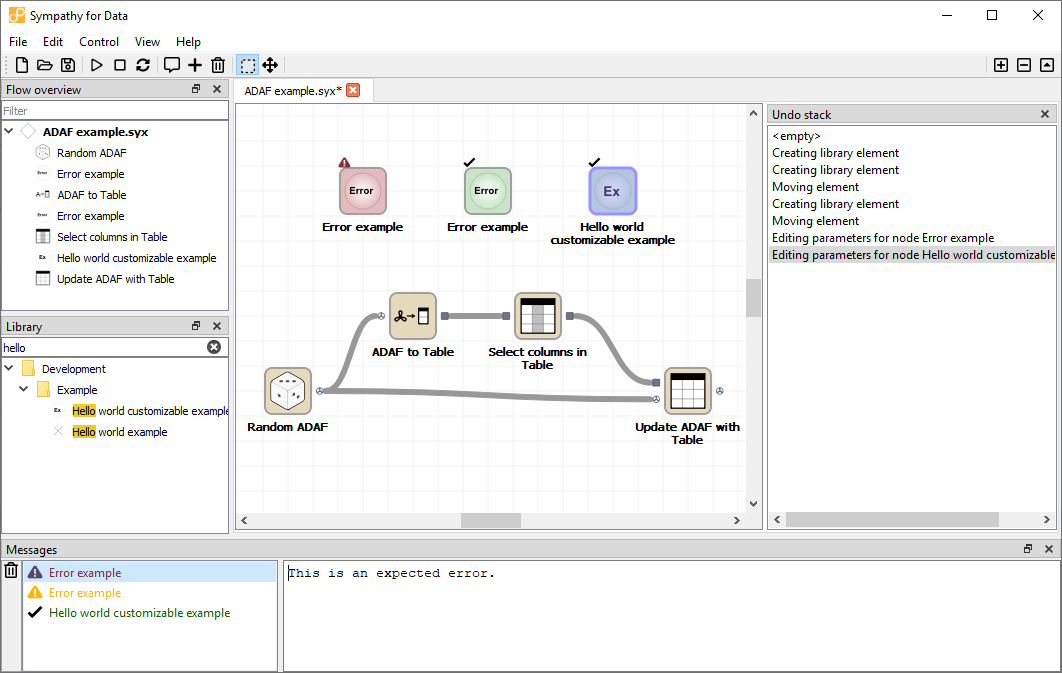
Screenshot of Sympathy for Data with all windows in use.
Library window
It is through the node library window that you get access to the nodes, the building blocks of the data analysis workflows. The nodes are stored in a tree structure and are categorized by their functionalities. The nodes are added to the flow with drag and drop.
There are two ways of getting more information about a node in the library window. Brief information, consisting of a short description and a declaration of the incoming and outgoing data types, is displayed in a tooltip when resting the cursor over a node in the library view. The more detailed documentation is accessed by right clicking on the node and selecting “Help”. A web browser will open to display the node documentation. Documentation for all nodes in the library can also be found here.
It is possible to add new node libraries to the node library window. These are generally referred to as third-party libraries. When you have downloaded a third-party library you can add it to Sympathy in the preferences dialog. Go to the page Node libraries and click add. Then add the folder containing the Library folder.
Searching for nodes
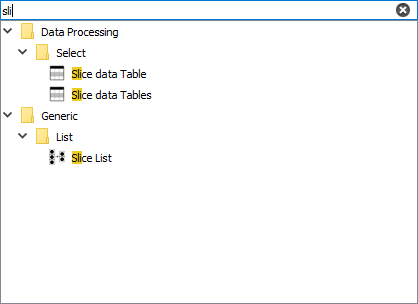
You can search for nodes in the node library by typing search terms into the filter textbox. The search supports multiple search terms, which you can enter seperated by a space. For a node to match, each search terms must appear in a different word in the order that you typed them.
Screenshots with examples of how to search in the library window are shown below.
Screenshot of searching with one search term
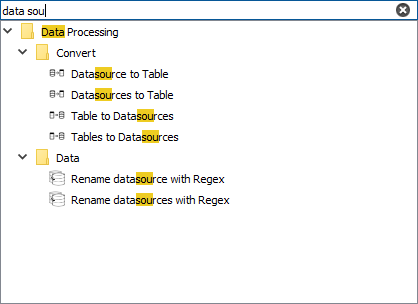
Screenshot of searching with multiple search terms
Messages window
The Messages window is where all output from nodes ends up; be it errors, warnings, or simple notices.
When a node has something to say it will add a single row with the node’s label to the left column of the Messages window. Select the this row to see the contents of the message.
You can right-click anywhere in the left column and choose Clear All to remove any old content from this view and more easily notice new output.
There are four different severities in the output, ranging from least to most severe:
- Notice
Informative non-crucial output that does not affect the node’s ability to complete its task. For messages at this level the node label is green and accompanied by a tick mark.
- Warnings
A node will give you a warning when it suspects that something might be wrong, but it is still able to complete its task. You should usually take a look at any warnings and judge for yourself if some action needs to be taken. For messages at this level the node label is yellow and accompanied by a yellow warning sign.
- Error
An unrecoverable error occurred during node execution. These errors are usually due to problems with either the node’s configuration or the data that it received. The details can sometimes give more information about how to fix the problem. For error messages the node label is red and accompanied by a red warning sign.
- Exception
Like the Error level this also represents some unrecoverable error during node execution. The difference is that an exception is some kind of error that the node developer has not anticipated. Sometimes these errors can be fixed simply by fixing some problem with the configuration or input data, but it can also be that there is some problem that needs to be fixed in the source code for the node.
A good quality node should in principle never give exceptions. You should consider reporting any exceptions you see to the node developer by right-clicking on the node’s label and choosing Report Issue. The content of an exception message will include a stack trace which gives information to the node developer about where in the code the error arose. For exceptions the node label is red and accompanied by a icon of a little bug.
Flow overview
The flow overview can be accessed via the view menu. It shows all subflows and nodes in the current workflow. Click on a node or subflow to jump to that node or subflow.
When typing something into the filter textbox only subflows and nodes whose labels match the filter are shown. This can help you quickly find nodes or subflows even in very large workflows.
How to search from the flow overview textbox is similar as in the library window. See also Searching for nodes .
Undo stack
The undo stack shows all historical operations preformed in the active workflow. Each operation (create node, move node, delete node, connect nodes etc.) is represented by a row in the undo stack with new operations being added at the bottom. If you select a specific row Sympathy will undo all operations below the selected row, effectively jumping to a point in time just after the selected operation was performed.