Report Template Tables
Editor for designing a report template.
| Ref. nodes: | Report Apply Tables Report Template ADAFs |
|---|
Ports:
Inputs:
tables: [table]
List of tables to use as source of data when building template
Outputs:
template: report
Report Template
Configuration:
- document
- JSON-data containing description of template.
Editor for designing a report template
Configuration
The configuration dialog is a large complex editor to design a layout for report templates. On the left side there are sections for handling scales, pages and properties. In the middle is the area showing the report given the input data. On the right is a view of the underlying JSON-data model (mostly used for debugging and will be removed in the future).
- Scales
Scales translates values in a domain (source) to values in a range (output). This is useful to generalize how data should be interpreted to achieve certain effects when generating a plot. Currently a numeric domain is mapped to either a numeric range or a range of colors.
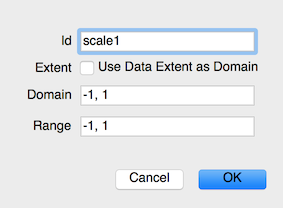
A new scale is created by clicking the plus sign above the list of scales. Double clicking the scale opens a configuration dialog.
- Id: Unique identifier of the scale. This name is used to reference the scale in other parts of the editor.
- Type: Type of scale, i.e. how domain data is mapped to range data.
- Extent: When enabled the total span of the input data to the scale is used as domain. This is useful when wanting to use a scale for many different data sources, but the same output is desired.
- Domain: The domain contains a list of numbers which must be given in ascending order.
- Range: The range should be either a list of numbers or a list of
colors with the same length as the domain list. Colors are
specified according to hex-RGB:
#rrggbb, e.g.#3288ed.
- Pages
The pages view is used to change the appearance of the template. There are two toolbars available with icons which can be dragged and dropped into the tree area below.
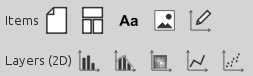
The first toolbar row contains the following icons from left to right:
- Page: A page is only allowed in the root level of the tree and translates into new tabs. When rendered using Report Apply Tables each page becomes a separate image.
- Layout: A layout can be specified as either horizontal och vertical. It can be a child of either a page or another layout. It is possible to build complex layouts by nesting different layout elements in each other.
- Text: A free text item.
- Image: A static image.
- Graph: The graph is a representation for a plot area, i.e. a set of axes. A graph has a set of dimensions which contain axes. The first dimension contains the x-axes, the second dimension the y-axes, and so forth. Currently only one axis per dimension is allowed, but the plan is to support several axes per dimension. The last node is called Layers and contains all plot layers which shows the total plot.
The second toolbar contains the layers which are currently available:
- Bar chart
- 1D histogram
- 2D histogram
- Line chart
- Scatter chart
- Properties
- The property view is used to manipulate parameters of the currently selected item in the page view.